6  Zebra escape trajectories

In this case study we will be using movement to quantify the collective behaviour of a herd of zebras in escape response. The data we will use is part of a larger dataset collected in Mpala (Kenya), in which researchers simulated a predation event to study the group response of the animals. We will demonstrate how we can compute useful metrics for this analysis using movement.

Using the right environment

If you are following along this chapter on your own computer, make sure to run all code snippets with the animals-in-motion-env environment activated (see prerequisites A.3.3).

6.1 Dataset description

The 3.5-min dataset presented here consists of 44 trajectories of zebras (Equus quagga) expressed in a coordinate system fixed to the ground. Each individual has two keypoints (head and tail). The data was obtained as follows: first, a trained SLEAP model was run on a video clip recorded from a camera drone, to obtain the trajectories of the zebras in a coordinate system linked to the drone. Then, the trajectories were expressed in a coordinate system fixed to the ground using Structure-from-motion (with OpenSFM and OpenDroneMap). This transformation between camera and world coordinate systems is necessary to be able to disentangle the motion of the zebras from the movement of the camera drone. After this coordinate transformation, the data was cleaned by removing low-confidence keypoints and implausible data points.

You can find a detailed description of the approach as a collection of notebooks in this repository. Further details about the dataset and the prototype pipeline can be found in Duporge, Miñano et al (2025).

Acknowledgement

The sample video and original SLEAP trajectories were kindly shared by Dr. Isla Duporge from the Rubenstein Lab at Princeton University, with permission to use for this workshop. The trajectories in world coordinate system were computed by Sofía Miñano, Niko Sirmpilatze and Igor Tatarnikov.

6.2 Load and explore the dataset

First, let’s load and explore the dataset

import matplotlib.pyplot as plt

import numpy as np
import xarray as xr

from movement import sample_data
from movement.kinematics import compute_pairwise_distances, compute_speed
from movement.transforms import scale
from movement.utils.vector import compute_norm, convert_to_unit
from movement.utils.reports import report_nan_values
Downloading data from 'https://gin.g-node.org/neuroinformatics/movement-test-data/raw/master/metadata.yaml' to file '/home/runner/.movement/data/temp_metadata.yaml'.
SHA256 hash of downloaded file: ab9c9c95a3f8366583e2cdb9c84610c62bd0bb0c6cbbcbbdc6a3390b6108623f
Use this value as the 'known_hash' argument of 'pooch.retrieve' to ensure that the file hasn't changed if it is downloaded again in the future.
ds = sample_data.fetch_dataset("SLEAP_OSFM_zebras_drone.h5")
ds
Downloading file 'poses/SLEAP_OSFM_zebras_drone.h5' from 'https://gin.g-node.org/neuroinformatics/movement-test-data/raw/master/poses/SLEAP_OSFM_zebras_drone.h5' to '/home/runner/.movement/data'.
0.00B [00:00, ?B/s]17.4kB [00:00, 106kB/s]49.2kB [00:00, 156kB/s]115kB [00:00, 264kB/s] 147kB [00:00, 237kB/s]246kB [00:00, 364kB/s]330kB [00:01, 411kB/s]502kB [00:01, 613kB/s]590kB [00:01, 444kB/s]729kB [00:01, 433kB/s]777kB [00:02, 400kB/s]822kB [00:02, 408kB/s]865kB [00:02, 366kB/s]906kB [00:02, 331kB/s]961kB [00:02, 329kB/s]1.01MB [00:02, 315kB/s]1.06MB [00:02, 314kB/s]1.11MB [00:03, 308kB/s]1.16MB [00:03, 306kB/s]1.22MB [00:03, 320kB/s]1.27MB [00:03, 315kB/s]1.32MB [00:03, 312kB/s]1.38MB [00:03, 324kB/s]1.43MB [00:04, 319kB/s]1.48MB [00:04, 314kB/s]1.54MB [00:04, 324kB/s]1.59MB [00:04, 319kB/s]1.64MB [00:04, 338kB/s]1.68MB [00:04, 335kB/s]1.71MB [00:04, 334kB/s]1.75MB [00:05, 305kB/s]1.81MB [00:05, 320kB/s]1.87MB [00:05, 332kB/s]1.92MB [00:05, 329kB/s]1.98MB [00:05, 328kB/s]2.04MB [00:05, 351kB/s]2.10MB [00:06, 346kB/s]2.16MB [00:06, 345kB/s]2.22MB [00:06, 353kB/s]2.28MB [00:06, 355kB/s]2.33MB [00:06, 285kB/s]2.40MB [00:07, 341kB/s]2.44MB [00:07, 339kB/s]2.47MB [00:07, 306kB/s]2.52MB [00:07, 302kB/s]2.58MB [00:07, 303kB/s]2.62MB [00:07, 328kB/s]2.66MB [00:07, 326kB/s]2.69MB [00:07, 329kB/s]2.74MB [00:08, 318kB/s]2.78MB [00:08, 243kB/s]2.84MB [00:08, 308kB/s]2.87MB [00:08, 309kB/s]2.91MB [00:08, 311kB/s]2.94MB [00:08, 273kB/s]2.97MB [00:08, 278kB/s]3.00MB [00:09, 253kB/s]3.05MB [00:09, 269kB/s]3.10MB [00:09, 291kB/s]3.13MB [00:09, 289kB/s]3.16MB [00:09, 290kB/s]3.19MB [00:09, 291kB/s]3.22MB [00:09, 269kB/s]3.25MB [00:09, 284kB/s]3.28MB [00:10, 295kB/s]3.31MB [00:10, 273kB/s]3.34MB [00:10, 277kB/s]3.38MB [00:10, 287kB/s]3.41MB [00:10, 270kB/s]3.43MB [00:10, 272kB/s]3.47MB [00:10, 301kB/s]3.50MB [00:10, 277kB/s]3.53MB [00:10, 279kB/s]3.57MB [00:11, 309kB/s]3.60MB [00:11, 285kB/s]3.63MB [00:11, 288kB/s]3.67MB [00:11, 318kB/s]3.70MB [00:11, 293kB/s]3.74MB [00:11, 300kB/s]3.78MB [00:11, 323kB/s]3.81MB [00:11, 299kB/s]3.84MB [00:11, 296kB/s]3.89MB [00:12, 303kB/s]3.94MB [00:12, 246kB/s]4.00MB [00:12, 306kB/s]4.04MB [00:12, 289kB/s]4.08MB [00:13, 203kB/s]4.15MB [00:13, 267kB/s]4.19MB [00:13, 247kB/s]4.21MB [00:13, 207kB/s]4.24MB [00:13, 209kB/s]4.26MB [00:13, 189kB/s]4.28MB [00:13, 184kB/s]4.30MB [00:14, 186kB/s]4.32MB [00:14, 174kB/s]4.34MB [00:14, 159kB/s]4.36MB [00:14, 166kB/s]4.38MB [00:14, 173kB/s]4.40MB [00:14, 162kB/s]4.42MB [00:14, 160kB/s]4.45MB [00:15, 155kB/s]4.47MB [00:15, 158kB/s]4.50MB [00:15, 163kB/s]4.52MB [00:15, 184kB/s]4.54MB [00:15, 175kB/s]4.56MB [00:15, 161kB/s]4.59MB [00:15, 175kB/s]4.61MB [00:15, 185kB/s]4.63MB [00:16, 177kB/s]4.65MB [00:16, 166kB/s]4.68MB [00:16, 177kB/s]4.72MB [00:16, 183kB/s]4.75MB [00:16, 207kB/s]4.77MB [00:16, 204kB/s]4.79MB [00:16, 204kB/s]4.82MB [00:17, 196kB/s]4.86MB [00:17, 196kB/s]4.89MB [00:17, 217kB/s]4.92MB [00:17, 224kB/s]4.94MB [00:17, 223kB/s]4.97MB [00:17, 211kB/s]5.01MB [00:17, 217kB/s]0.00B [00:00, ?B/s]    0.00B [00:00, ?B/s]
<xarray.Dataset> Size: 7MB
Dimensions:      (time: 6294, space: 2, keypoints: 2, individuals: 44)
Coordinates:
  * time         (time) float64 50kB 0.0 0.03337 0.06673 ... 209.9 209.9 210.0
  * space        (space) <U1 8B 'x' 'y'
  * keypoints    (keypoints) <U1 8B 'H' 'T'
  * individuals  (individuals) <U8 1kB 'track_0' 'track_1' ... 'track_43'
Data variables:
    position     (time, space, keypoints, individuals) float32 4MB 1.035e+03 ...
    confidence   (time, keypoints, individuals) float32 2MB 0.9987 ... 1.006
Attributes:
    source_software:  SLEAP
    ds_type:          poses
    fps:              29.97
    time_unit:        seconds
    source_file:      /home/runner/.movement/data/poses/SLEAP_OSFM_zebras_dro...

We can see the poses dataset ds is made up of two data arrays, position and confidence. In this example, we will use the position data array only, which spans four dimensions: time, space, keypoints and individuals. We can verify there are 44 individuals in this dataset (track_0 to track_43) and two keypoints per individual, labelled H (head) and T (tailbase). The data was collected at 29.97 frames per second, and the dataloader used this information to automatically express the time dimension in seconds.

Position units

The position data in ds is expressed in arbitrary units. This is because no GPS data was available for georeferencing or defining ground control points in the structure-from-motion (SfM) analysis. As a result, the scale factor remains a free parameter in the reconstruction of the world coordinates.

Note however that this will not be a problem for our analysis, since the relative positions between the individuals are still correct. Moreover, we will use the median zebra body length to scale the data to more informative units. For more details on the coordinate systems involved in SfM analysis see the OpenSfM documentation.

6.3 Compute the body length per individual

We define the body vector for each individual as the vector going from the T keypoint (tail) to the H keypoint (head).

body_vector = ds.position.sel(keypoints="H") - ds.position.sel(keypoints="T")

body_vector
<xarray.DataArray 'position' (time: 6294, space: 2, individuals: 44)> Size: 2MB
-20.64 -13.41 17.4 8.969 21.4 -4.405 ... -0.1141 3.393 4.625 19.86 8.691 -4.683
Coordinates:
  * time         (time) float64 50kB 0.0 0.03337 0.06673 ... 209.9 209.9 210.0
  * space        (space) <U1 8B 'x' 'y'
  * individuals  (individuals) <U8 1kB 'track_0' 'track_1' ... 'track_43'

We can compute the body length of each individual by computing the norm of the body vector.

# Compute body length per individual
body_length = compute_norm(body_vector)

It would be useful to check if there are missing values in the body length array. We can quickly inspect this using movement’s report_nan_values function.

print(report_nan_values(body_length))
Missing points (marked as NaN) in position:

individuals
track_0       234/6294 (3.72%)
track_1       286/6294 (4.54%)
track_10      614/6294 (9.76%)
track_11      369/6294 (5.86%)
track_12      519/6294 (8.25%)
track_13      420/6294 (6.67%)
track_14      353/6294 (5.61%)
track_15       434/6294 (6.9%)
track_16     827/6294 (13.14%)
track_17      241/6294 (3.83%)
track_18      483/6294 (7.67%)
track_19      196/6294 (3.11%)
track_2      645/6294 (10.25%)
track_20      557/6294 (8.85%)
track_21      576/6294 (9.15%)
track_22        88/6294 (1.4%)
track_23     633/6294 (10.06%)
track_24       85/6294 (1.35%)
track_25       43/6294 (0.68%)
track_26     813/6294 (12.92%)
track_27       315/6294 (5.0%)
track_28    1208/6294 (19.19%)
track_29      127/6294 (2.02%)
track_3       224/6294 (3.56%)
track_30      235/6294 (3.73%)
track_31       91/6294 (1.45%)
track_32        25/6294 (0.4%)
track_33      362/6294 (5.75%)
track_34       447/6294 (7.1%)
track_35     742/6294 (11.79%)
track_36     741/6294 (11.77%)
track_37     766/6294 (12.17%)
track_38      415/6294 (6.59%)
track_39    1254/6294 (19.92%)
track_4        17/6294 (0.27%)
track_40      523/6294 (8.31%)
track_41      263/6294 (4.18%)
track_42      236/6294 (3.75%)
track_5        93/6294 (1.48%)
track_6      718/6294 (11.41%)
track_7       432/6294 (6.86%)
track_8      731/6294 (11.61%)
track_9       388/6294 (6.16%)
track_43      548/6294 (8.71%)

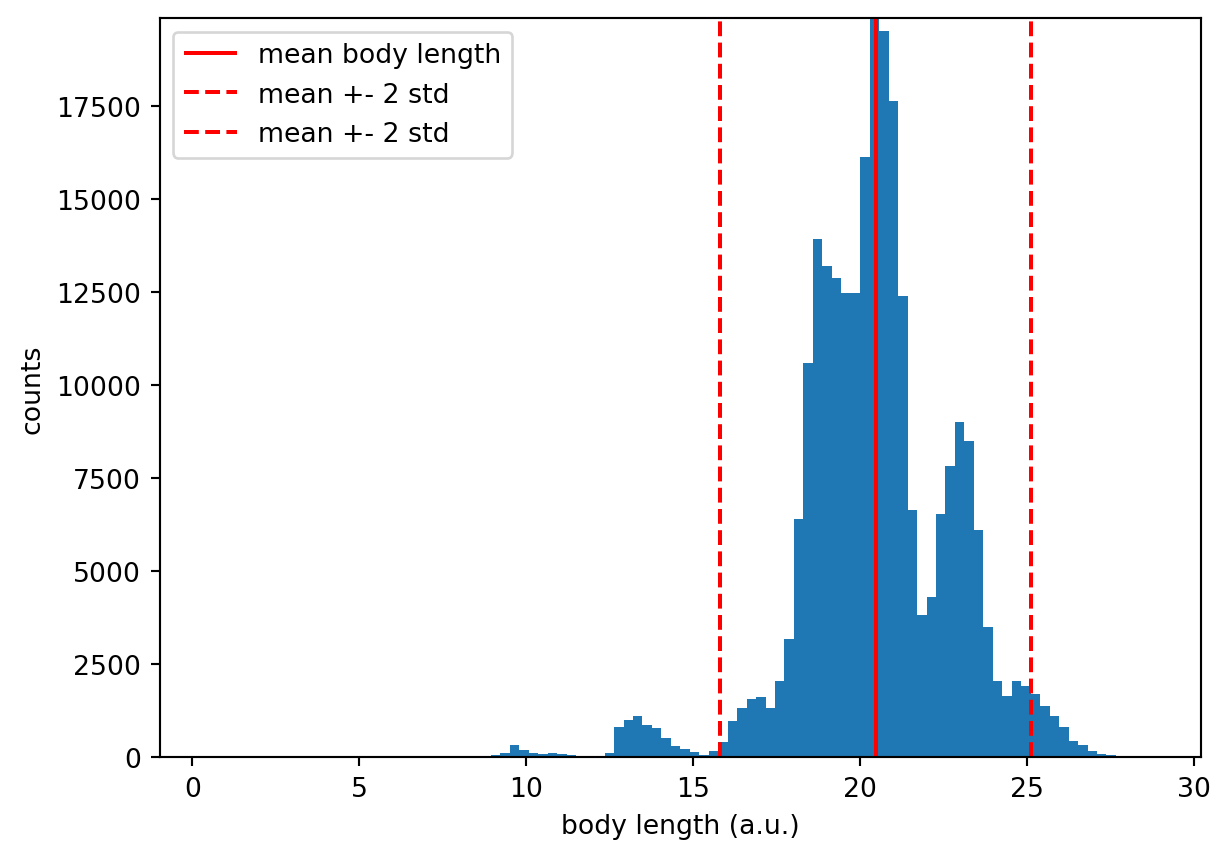
The output shows that the number of missing values per individual varies between 0.27% and 19.92%. This is not necessarily a problem for our analysis, but it is something to keep in mind when interpreting the results. These missing points are likely due to imperfect tracking of one or both of the keypoints required to compute the body vector.

Let’s compute some basic statistics to get a sense of the distribution of the body length values.

# Compute basic statistics
body_length_std = body_length.std()
body_length_mean = body_length.mean()
body_length_median = body_length.median()

print(f"Body length mean: {body_length_mean:.2f} a.u.")  # a.u.: arbitrary units
print(f"Body length median: {body_length_median:.2f} a.u.")
print(f"Body length std: {body_length_std:.2f} a.u.")
Body length mean: 20.45 a.u.
Body length median: 20.43 a.u.
Body length std: 2.32 a.u.

We can also plot the distribution of body lengths.

Code
fig, ax = plt.subplots()

# plot histogram of body length values
counts, bins, _ = body_length.plot.hist(bins=100)

# add reference lines for mean and mean +- 2 stds
ax.vlines(
    body_length_mean,
    ymin=0,
    ymax=np.max(counts),
    color="red",
    linestyle="-",
    label="mean body length",
)
lower_bound = body_length_mean - 2 * body_length_std
upper_bound = body_length_mean + 2 * body_length_std
for bound in [lower_bound, upper_bound]:
    ax.vlines(
        bound,
        ymin=0,
        ymax=np.max(counts),
        color="red",
        linestyle="--",
        label="mean +- 2 std",
    )
ax.set_ylim(0, np.max(counts))
ax.set_xlabel("body length (a.u.)")
ax.set_ylabel("counts")
ax.legend()
Figure 6.1: Distribution of zebra body lengths.

We can see there is some variability in the body lengths per individual. Part of it may reflect the diversity across individuals, but from visual inspection of the video we expect the majority of it to be due to imperfect tracking of the keypoints. To remove some of these outliers, we continue the analysis considering only body vectors that are within 2 standard deviations of the mean.

body_vector_filtered = body_vector.where(
    np.logical_and(
        body_length <= body_length_mean + 2 * body_length_std,
        body_length >= body_length_mean - 2 * body_length_std,
    )
)

6.4 Compute polarization

We would now like to inspect the orientation of each individual in relation to the group while the simulated escape events take place.

For this, we first compute each animal’s unit body vector. These are a scaled version of the body vectors we just computed, normalised to have unit length. movement provides a convenience function to do this:

body_vector_filtered_unit = convert_to_unit(body_vector_filtered)

We can quickly check if their norms are now equal to 1.

print(compute_norm(body_vector_filtered_unit)) 
<xarray.DataArray 'position' (time: 6294, individuals: 44)> Size: 1MB
1.0 nan 1.0 1.0 1.0 1.0 1.0 1.0 1.0 nan ... 1.0 1.0 nan 1.0 1.0 1.0 1.0 1.0 1.0
Coordinates:
  * time         (time) float64 50kB 0.0 0.03337 0.06673 ... 209.9 209.9 210.0
  * individuals  (individuals) <U8 1kB 'track_0' 'track_1' ... 'track_43'

We now define the herd vector as the mean of the unit body vectors across all individuals. The mean vector of a set of \(n\) vectors is the sum of all the vectors (i.e., the resultant vector) scaled by \(1/n\).

herd_vector = body_vector_filtered_unit.mean("individuals")
print(herd_vector) 
<xarray.DataArray 'position' (time: 6294, space: 2)> Size: 50kB
0.5835 -0.4923 0.5589 -0.4968 0.5252 ... 0.4129 0.3367 0.4131 0.3156 0.4332
Coordinates:
  * time     (time) float64 50kB 0.0 0.03337 0.06673 ... 209.9 209.9 210.0
  * space    (space) <U1 8B 'x' 'y'

The resulting array has (time, space) dimensions, which means that we have a single herd vector defined at each timestep.

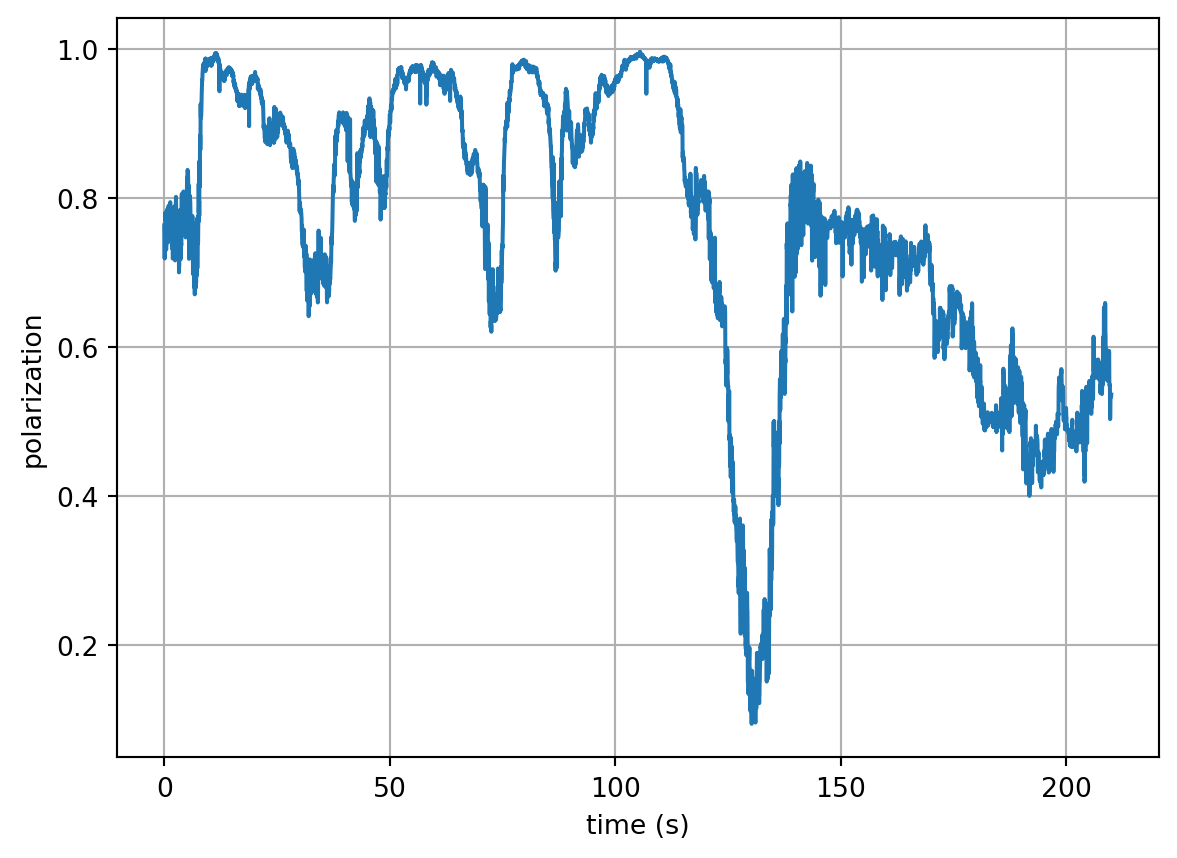
The norm of the herd vector already gives us an intuition of how aligned the whole herd is. When its norm is close to 1, it means that the majority of the unit body vectors are aligned. When its norm is close to 0, it means that the unit body vectors are dispersed. The norm of the herd vector is sometimes called polarization.

polarization = compute_norm(herd_vector)

We can plot the evolution of the polarization over time to get a sense of how the herd’s alignment changes.

fig, ax = plt.subplots()
ax.plot(herd_vector.time, polarization)
ax.set_ylabel("polarization")
ax.set_xlabel("time (s)")
ax.grid()
Figure 6.2: Evolution of the herd’s polarization over time.

The plot suggests that the herd alternates between periods of higher and lower polarization.

6.5 Compute average speed of the herd

We would also like to inspect how the speed of the herd changes over the course of the simulated escape events.

First, let’s scale the position data to express it in units of body lengths (BL). This will make the results more interpretable. We can use movement’s scale function to do this.

position_scaled = scale(
    ds.position, 
    factor=1 / body_length_median.item(), 
    space_unit="body_length",
)

For simplicity, we would also like to reduce the position of each individual to a single point. A good candidate for this is the centroid, which is the mean of all the keypoints per individual. In our case, the centroid will be the midpoint between the head and tail keypoints.

centroid = position_scaled.mean("keypoints")
Exercise A

Use the centroid data array to:

  1. Compute centroid_speed, the speed of each individual’s centroid.
  2. Compute herd_speed, the average speed across all individuals.
  3. Plot the evolution of herd_speed over time.

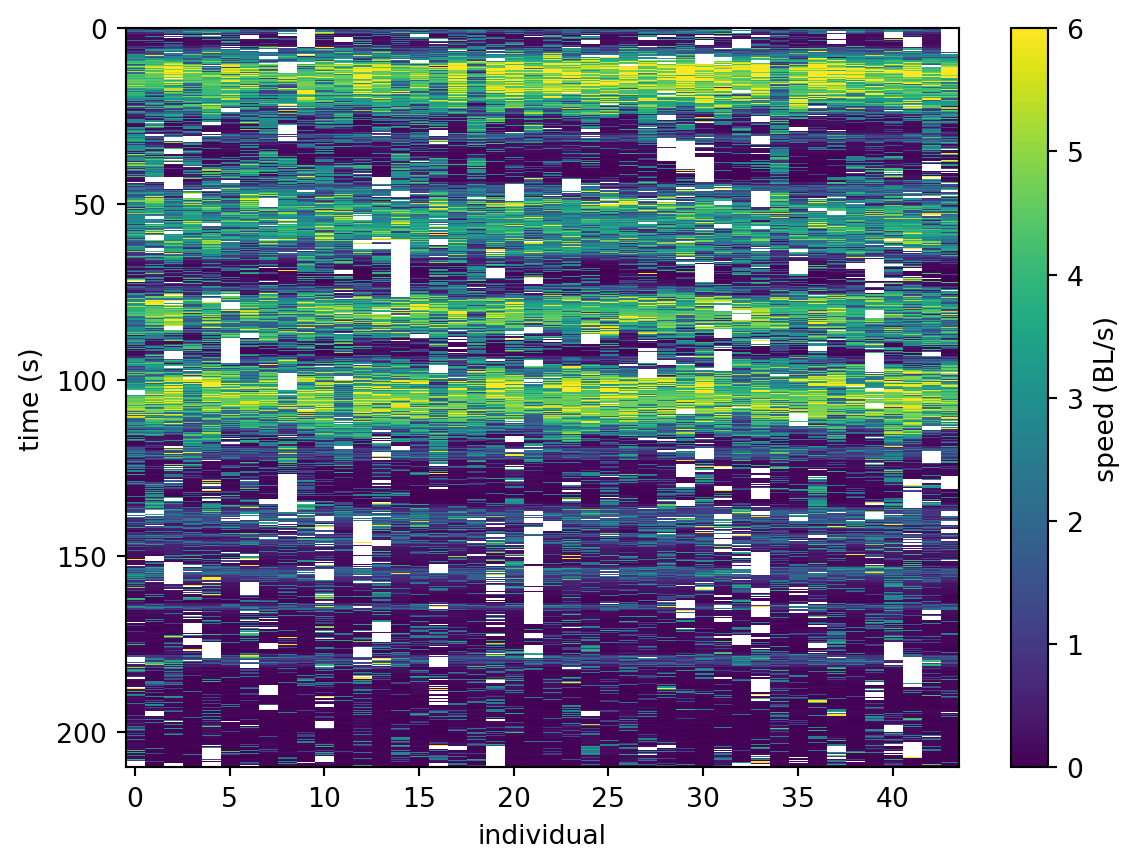
We can also inspect how the speed of each individual changes over time.

Code
fig, ax = plt.subplots()
im = ax.matshow(
    centroid_speed,
    aspect="auto",
    cmap="viridis",
)

# convert frames to seconds in y-axis
time_ticks_step = 1498
time_ticks = np.arange(0, len(centroid_speed.time), time_ticks_step) 
time_labels = [f"{t:.0f}" for t in centroid_speed.time.values[0:-1:time_ticks_step]]
ax.set_yticks(time_ticks)
ax.set_yticklabels(time_labels)
ax.tick_params(axis='x', bottom=True, top=False, labelbottom=True, labeltop=False)

ax.set_xlabel("individual")
ax.set_ylabel("time (s)") 

# add colorbar
cbar = plt.colorbar(im)
cbar.set_label("speed (BL/s)")
ax.get_images()[0].set_clim(0, 6) # cap values at 6 BL/s
Figure 6.3: Evolution of the speed of each individual over time.

The plot suggests that the individuals are quite coordinated also in their change of speed. We can clearly see the four periods of higher speed, which correspond to the four simulated escape events.

6.6 Polarization vs speed

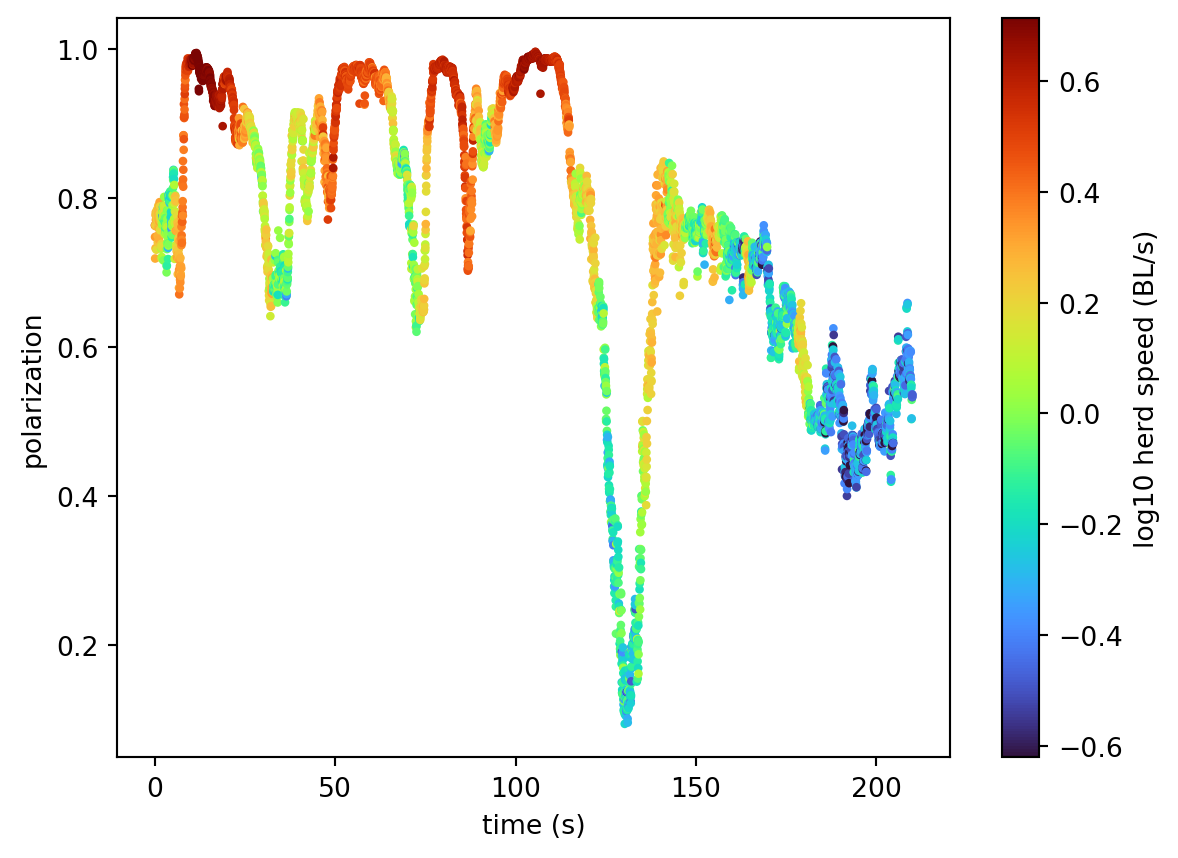
Let’s put it all together and inspect how polarization changes with the speed of the herd.

We will use the logarithm of the speed to focus on the higher range of speeds.

log10_herd_speed = np.log10(herd_speed)

We can now plot the polarization in time, colouring the points by the logarithm of the speed.

fig, ax = plt.subplots()
sc = ax.scatter(
    x=polarization.time,
    y=polarization,
    c=log10_herd_speed,
    s=5,
    cmap="turbo",
    # rescale color map to 1st and 99th percentiles
    vmin=log10_herd_speed.quantile(0.01).item(),
    vmax=log10_herd_speed.quantile(0.99).item(),
)


ax.set_xlabel("time (s)")
ax.set_ylabel("polarization")

cbar = plt.colorbar(sc)
cbar.set_label("log10 herd speed (BL/s)")
Figure 6.4: Periods of highest polarization are associated with higher speeds

The plot shows that for this dataset, the periods of highest polarization are associated with higher speeds. This is consistent with the interpretation that the zebras become more aligned when escaping at speed, and more dispersed when they are at rest.